|
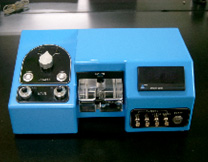
PDA2000
for Laboratory
 |
It is characterized to analyze the flocs in the
process of coagulation and flocculation. It is a simple, but
very sensitive monitor for flowing flocs, based on an optical
technique. It is a good tool for determining the optimal dosing
amount of coagulant and forming the good flocs in a laboratory
and pilot scales. |
Application Scopes:
- Selection of optimum flocculant dosage
- Control of dispersion and process
- Assessment of the strength of flocs
- Determining the optimal coagulant dose |
Advantages:
- Easy operating and maintenance
- A very wide range of flocs concentrations can be directly
monitored
- Floc measuring in the real time |
| Set-up for lab test for coagulation
|
|
Nature of the Technique
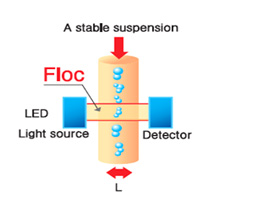 |
The
flowing suspension is illuminated by a narrow beam of light
perpendicular to the direction of flow.
For the PDA2000, a novel flow cell has been developed; transparent
flexible tubing fits in a Perspex block
that houses two precisely aligned fibre-optic probes. The
optical fibres carry the incident and transmitted
light, as shown in Figure 1. The light source is a high intensity
light-emitting diode and the transmitted light is
continuously monitored by a sensitive photodiode.
|
The output from the photodiode is converted to a voltage, which consists
of a large DC component, together with a small, fluctuating (AC) component.
The DC component is simply a measure of the average transmitted light
intensity and is dependent on the turbidity of the suspension. The
AC component
arises from random variations in the number of particles in the sample
(i.e. the volume illuminated by the light beam, typically of the order
of 1mm3 in the
PDA2000). Because the suspension flows through the cell, the actual
sample in the light beam is continually being renewed and local variations
in
particle number concentration give fluctuations in the transmitted
light intensity. These fluctuations cease when the flow is stopped.
The root mean square (RMS) value of the fluctuating (AC) signal
is related to the average number concentration and size of the suspended
particles.
For fairly uniform suspensions, estimates of particle size and number
concentration can be made, but the main use of the PDA2000 is in
the monitoring of
flocculation and dispersion processes.
The RMS value of the fluctuating signal increases, when aggregation
of particles occurs. Measurable changes in the RMS value occur long
before any
visible signs of aggregation are apparent. Conversely, when aggregates
are disrupted, the RMS value decreases, reaching a minimum when
disaggregation
(or dispersion) is complete. The DC value (related to the turbidity)
is much less sensitive to changes in the state of aggregation.
Operation of the PDA2000
The flow cell supplied with the PDA2000 can accommodate standard
plastic tubing of either 1mm or 3mm internal diameter. The choice
of tubing depends
on the nature of the suspension and the amount available. The 3mm
tubing requires a minimum suspension flow rate of 20ml/min and would
be used in many
industrial applications. However, for highly turbid suspensions,
the transmitted light intensity might be too low and the 1mm tubing
would then be chosen
because of the shorter optical path length.
Flow rate in the 1mm tube can be as low as 2ml/min, so this might
be chosen for laboratory applications where only small sample volumes
are available.
Because of the high shear caused by flow in narrow tubes, some disruption
of weak aggregates might occur in the 1mm tube at quite low flow
rates.
This effect can be exploited to give an empirical measure of floc
strength. The DC and RMS readings are available as outputs on the
PDA2000.
Both readings can be adjusted by precision 10-turn gain controls,
enabling a wide range of suspension concentrations and conditions
to be monitored.
Another output is the result of dividing the RMS value by the DC
reading. This ratio output is the most useful one for routine monitoring
of flocculation or
dispersion processes. The ratio varies with solids concentration
in a fairly straightforward manner and is almost entirely unaffected
by contamination
of the tube walls in the flow cell or by drift in the electronic
components. These effects cause changes in the DC value (and can
be a serious problem
in flow-through turbidity measurements). However the RMS value of
the voltage fluctuations is changed in the same proportion, so that
the ratio of
the two values does not change. This means that the ratio output
can be monitored for long periods without the need for re-calibration
or re-checking of
the zero reading. Having established the appropriate gain settings
for the suspension under test; the DC, RMS and ratio outputs can
be continuously
monitored on a data logger, chart recorder or other device. Any
one of the outputs can be selected for digital display on the front
panel of the instrument
by push-button switches. Smoothing of the outputs can be selected
by another switch. A limit switch is provided which enables effects
due to air bubbles
or non-representative large particles to be partially compensated.
Response of the PDA2000
Useful readings can be obtained over a very wide range of suspension
concentrations. The limits depend on the nature of the particles
and the tube diameter,
but, as a rough guide, concentrations from a few PPM to several
percent solids can be directly monitored. For more concentrated
suspensions some form
of in-line dilution would be necessary. The limits of particle size
are roughly 0.5 to 100µm, determined largely by the diameter of
the light beam (1mm in the
PDA2000). In non-uniform suspensions, larger particles give the
dominant contribution to the RMS and ratio values. The concentration
and particle
size limits are inter-related to some extent. Thus, for larger particles,
lower concentrations can be detected.
Aggregation of particles can easily cause changes in RMS (or ratio)
output by a factor of five or more before any visible changes in
the suspension become
apparent. Corresponding changes in the DC output are only of the
order of a few percent.
Suggested Applications
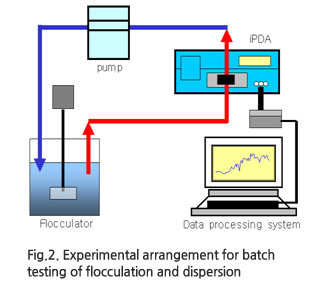 |
Figure
2
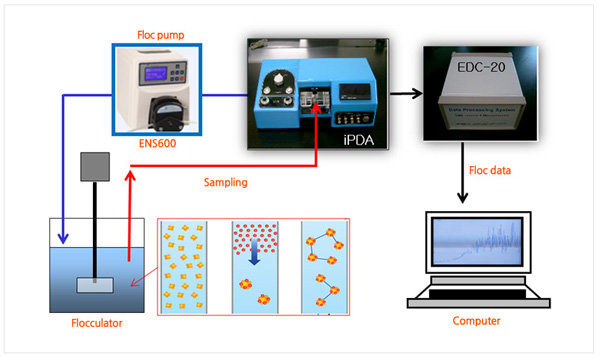
In laboratory studies of flocculation and dispersion processes,
the PDA2000 can be used in several ways.
A very simple approach is to continuously sample from a stirred
vessel as in Figure 2. After passing
through the flow cell the sample can be returned to the vessel
by means of a peristaltic pump or can
go to waste. A range of different dosages of additive (dispersant
or flocculent) can be explored and
the response of the PDA2000 (usually the ratio output) can
be monitored. The speed of response
depends on the suspension concentration - from as little as
a few seconds for concentrated suspensions
to a minute or two for dilute samples. Optimum flocculation
corresponds to a maximum in the ratio reading
after a standard stirring time. For dispersion processes,
the dosage giving the minimum reading is
chosen. As well as giving a rapid indication of the optimum
dosage of a particular additive,
realistic comparisons between different additives can be made
with the simple set-up in Figure 2.
|
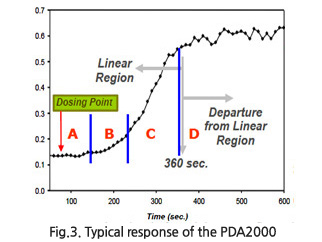
| Figure
3
Figure 3 shows a typical response of the PDA2000 used in this
way. The suspension is of clay (kaolin)
and the additives are a calcium salt and a cationic polymer.
Both of these cause flocculation of the kaolin
particles and the ratio response begins to show an increase
very shortly after addition of the flocculents.
In the case of the polymer the rate of increase is greater,
indicating a more rapid flocculation and
the ultimate value attained is greater than with the calcium
salt, showing that the flocs formed by
the cationic polymer are stronger (they can grow to a larger
size in the stirred vessel).
|
 |
The turbidity fluctuation technique as used in the PDA2000,
has been shown to be an effective method of monitoring flocculation
processes in water and
effluent treatment applications. Several other industrial applications
are being evaluated. With an effective, on-line monitor of flocculation
and dispersion
processes, the need for routine measurements of particle change
(or zeta potential) is largely eliminated. |
Ordering Information
|
Order Code |
Description |
| PDA001A |
PDA2000 Particle Dispersion Analyser — 240V
|
| PDA002A |
PDA2000 Particle Dispersion Analyser — 110V |
| PDA108A |
5mm tube adaptor for PDA2000 |
| OXY036Z |
Data Logger Pico ADC-20 (8 channel, 20 bit, USB)
|
| PDA005A |
Converter Box - PDA2000 to ADC-20 |
| PDA300A |
1mm tube |
| PDA301A |
3mm tube |
| PDA302A |
5mm tube |
|